Right heart catheterization is one of the most useful invasive tools for evaluating cardiopulmonary hemodynamics. It provides direct measurements of right-sided pressures, pulmonary artery pressures, pulmonary capillary wedge pressure, cardiac output, and oxygen saturation. When interpreted correctly, these values can help diagnose pulmonary hypertension, cardiac tamponade, constrictive physiology, valvular disease, shock states, and heart failure physiology.
This cheat sheet reviews the core measurements, important waveforms, normal pressure ranges, and common waveform abnormalities seen during right heart catheterization.
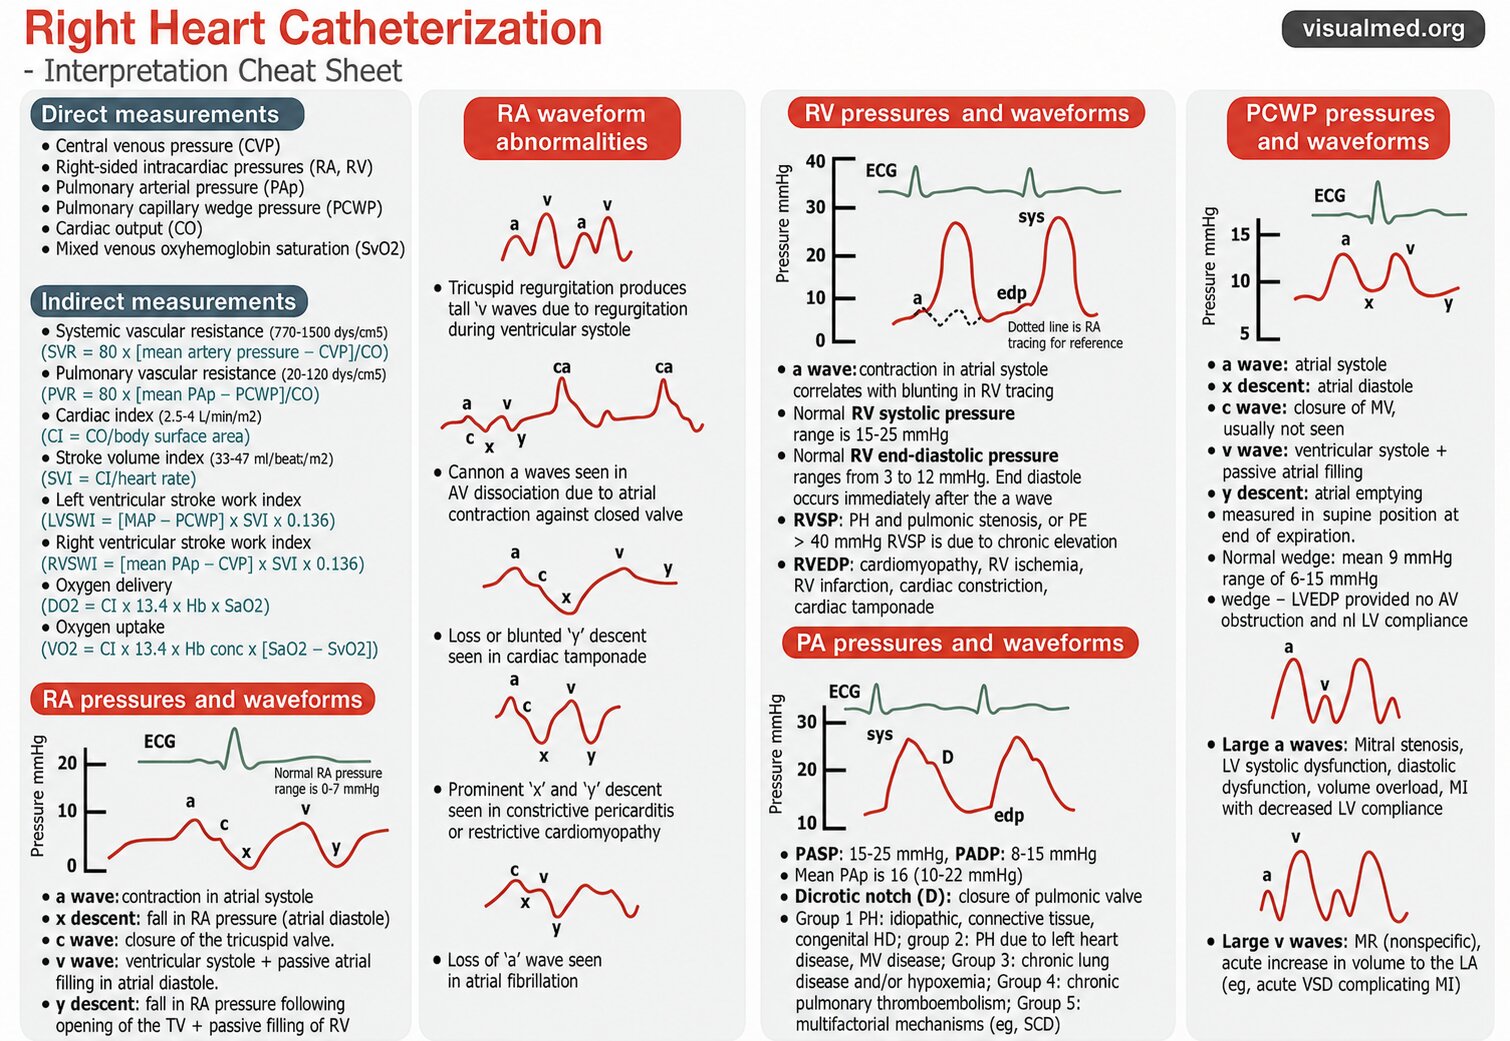
What Does Right Heart Catheterization Measure?
Right heart catheterization directly measures pressures and oxygen saturation from the right-sided circulation.
Direct measurements include:
- Central venous pressure
- Right atrial pressure
- Right ventricular pressure
- Pulmonary artery pressure
- Pulmonary capillary wedge pressure
- Cardiac output
- Mixed venous oxyhemoglobin saturation
These measurements help determine whether a patient’s symptoms are due to cardiac, pulmonary vascular, or volume-related abnormalities.
Important Derived Hemodynamic Measurements
Several important calculations can be derived from right heart catheterization data.
Systemic Vascular Resistance
Systemic vascular resistance reflects the resistance against which the left ventricle pumps.
Formula:
SVR = 80 × [(mean arterial pressure − CVP) / cardiac output]
Normal range is approximately 770–1500 dyn·s/cm⁵.
An elevated SVR may be seen in vasoconstricted states, while a low SVR can occur in distributive shock.
Pulmonary Vascular Resistance
Pulmonary vascular resistance reflects resistance in the pulmonary vascular bed.
Formula:
PVR = 80 × [(mean pulmonary artery pressure − PCWP) / cardiac output]
Normal range is approximately 20–120 dyn·s/cm⁵.
An elevated PVR suggests increased pulmonary vascular load and may be seen in pulmonary arterial hypertension, chronic thromboembolic disease, hypoxic lung disease, or other pulmonary vascular disorders.
Cardiac Index
Cardiac index adjusts cardiac output for body surface area.
Formula:
CI = cardiac output / body surface area
Normal cardiac index is approximately 2.5–4 L/min/m².
This is especially useful when comparing cardiac output across patients of different sizes.
Stroke Volume Index
Stroke volume index reflects the amount of blood pumped per beat, adjusted for body surface area.
Formula:
SVI = cardiac index / heart rate
Normal stroke volume index is approximately 33–47 mL/beat/m².
Ventricular Stroke Work Indices
Stroke work indices estimate the work performed by the ventricles.
Left ventricular stroke work index:
LVSWI = [MAP − PCWP] × SVI × 0.136
Right ventricular stroke work index:
RVSWI = [mean PAP − CVP] × SVI × 0.136
These calculations are useful in advanced hemodynamic assessment, particularly in shock, heart failure, and pulmonary hypertension.
Oxygen Delivery and Oxygen Uptake
Right heart catheterization also allows assessment of oxygen transport.
Oxygen delivery:
DO₂ = CI × 13.4 × Hb × SaO₂
Oxygen uptake:
VO₂ = CI × 13.4 × Hb concentration × [SaO₂ − SvO₂]
These values can help assess whether tissue oxygen delivery is adequate relative to metabolic demand.
Right Atrial Pressure and Waveforms
The right atrial waveform is one of the most important waveforms in right heart catheterization.
Normal right atrial pressure is usually 0–7 mmHg.
The RA waveform contains several components:
a wave
The a wave represents atrial contraction during atrial systole.
x descent
The x descent represents a fall in right atrial pressure during atrial relaxation and downward movement of the tricuspid annulus.
c wave
The c wave is related to closure or bulging of the tricuspid valve into the right atrium during early ventricular systole.
v wave
The v wave reflects ventricular systole with passive atrial filling while the tricuspid valve is closed.
y descent
The y descent reflects the fall in right atrial pressure after the tricuspid valve opens and the right ventricle fills.
Understanding these components helps identify important right-sided and pericardial conditions.
Right Atrial Waveform Abnormalities
Right atrial waveforms can provide major diagnostic clues.
Tall v waves
Tall v waves can be seen in tricuspid regurgitation because blood regurgitates back into the right atrium during ventricular systole.
Cannon a waves
Cannon a waves occur when the right atrium contracts against a closed tricuspid valve.
This can happen in AV dissociation, where atrial contraction is not coordinated with ventricular filling.
Blunted y descent
Loss or blunting of the y descent may be seen in cardiac tamponade.
In tamponade, impaired ventricular filling limits the normal rapid fall in right atrial pressure after the tricuspid valve opens.
Prominent x and y descents
Prominent x and y descents can be seen in constrictive pericarditis or restrictive cardiomyopathy.
These patterns reflect abnormal ventricular filling and exaggerated pressure changes due to limited cardiac compliance.
Loss of the a wave
Loss of the a wave is commonly seen in atrial fibrillation, because organized atrial contraction is absent.
Right Ventricular Pressures and Waveforms
The right ventricular tracing shows a low-pressure systolic upstroke and diastolic pressure pattern.
Normal values:
- RV systolic pressure: 15–25 mmHg
- RV end-diastolic pressure: 3–12 mmHg
The RV tracing often demonstrates a rapid systolic rise and fall. End-diastolic pressure is measured at the end of diastole, immediately after the a wave.
Elevated RV systolic pressure
An RV systolic pressure greater than 40 mmHg may suggest chronic pressure elevation. Causes include:
- Pulmonary hypertension
- Pulmonic stenosis
- Pulmonary embolism
Elevated RV end-diastolic pressure
Elevated RVEDP may be seen with:
- Cardiomyopathy
- RV ischemia
- RV infarction
- Constrictive physiology
- Cardiac tamponade
The RV waveform is especially important when evaluating pulmonary hypertension, RV failure, and pericardial disease.
Pulmonary Artery Pressures and Waveforms
The pulmonary artery waveform has a systolic peak, diastolic trough, and a characteristic dicrotic notch.
Normal values:
- Pulmonary artery systolic pressure: 15–25 mmHg
- Pulmonary artery diastolic pressure: 8–15 mmHg
- Mean pulmonary artery pressure: approximately 10–22 mmHg
The dicrotic notch represents closure of the pulmonic valve.
Pulmonary artery pressures are central to diagnosing and classifying pulmonary hypertension.
Pulmonary Hypertension Groups
The graphic highlights the major pulmonary hypertension groups:
Group 1
Pulmonary arterial hypertension, including idiopathic disease, connective tissue disease, and congenital heart disease.
Group 2
Pulmonary hypertension due to left heart disease, including mitral valve disease and left-sided filling pressure elevation.
Group 3
Pulmonary hypertension due to chronic lung disease and/or hypoxemia.
Group 4
Chronic thromboembolic pulmonary hypertension.
Group 5
Pulmonary hypertension due to multifactorial mechanisms, such as systemic or hematologic disease.
Right heart catheterization is essential for confirming pulmonary hypertension and distinguishing pre-capillary from post-capillary physiology.
Pulmonary Capillary Wedge Pressure and Waveforms
The pulmonary capillary wedge pressure estimates left atrial pressure when measured correctly.
Normal wedge pressure is approximately:
- Mean PCWP around 9 mmHg
- Usual range 6–15 mmHg
PCWP is typically measured in the supine position at end expiration.
The PCWP waveform resembles the left atrial pressure waveform.
a wave
The a wave represents atrial systole.
x descent
The x descent represents atrial relaxation and pressure fall.
c wave
The c wave corresponds to closure of the mitral valve, although it is often not clearly seen.
v wave
The v wave reflects ventricular systole with passive filling of the left atrium.
y descent
The y descent reflects atrial emptying after the mitral valve opens.
PCWP and LVEDP
PCWP can approximate LVEDP only under certain conditions.
The wedge pressure may approximate LVEDP when there is:
- No significant AV valve obstruction
- Normal left ventricular compliance
However, PCWP and LVEDP are not always interchangeable. Discordance can occur in mitral valve disease, abnormal left atrial compliance, pulmonary venous disease, or altered ventricular compliance.
Abnormal PCWP Waveforms
PCWP waveforms can reveal important left-sided pathology.
Large a waves
Large a waves may be seen with:
- Mitral stenosis
- LV systolic dysfunction
- LV diastolic dysfunction
- Volume overload
- Myocardial infarction with reduced LV compliance
These conditions increase resistance to left atrial emptying during atrial contraction.
Large v waves
Large v waves may be seen with:
- Mitral regurgitation
- Acute volume increase into the left atrium
- Acute ventricular septal defect complicating myocardial infarction
Large v waves are often associated with mitral regurgitation, but they are not entirely specific.
Practical Interpretation Approach
When interpreting a right heart catheterization, start systematically.
First, confirm that the pressure tracings are accurate and measured at end expiration. Then review each chamber in sequence.
A practical approach:
- Review right atrial pressure and waveform morphology.
- Assess RV systolic and end-diastolic pressures.
- Review pulmonary artery systolic, diastolic, and mean pressures.
- Examine the wedge pressure and waveform.
- Calculate PVR and SVR.
- Compare cardiac output and cardiac index.
- Review oxygen saturation and oxygen delivery.
- Integrate the numbers with the clinical picture.
The waveform morphology is just as important as the numeric pressure value.
Key Takeaway
Right heart catheterization is not simply a list of numbers. It is a dynamic hemodynamic study that requires interpretation of pressures, waveforms, oxygen saturation, and derived calculations.
The most important points to remember are:
- RA waveform abnormalities can reveal tricuspid regurgitation, AV dissociation, tamponade, constriction, and atrial fibrillation.
- RV pressures help identify pulmonary hypertension, RV strain, RV infarction, and restrictive or constrictive physiology.
- PA pressures and PVR are central to diagnosing pulmonary hypertension.
- PCWP helps estimate left-sided filling pressure and can reveal mitral valve or left atrial pathology.
- Waveform analysis is essential for accurate interpretation.
A careful, stepwise approach to right heart catheterization can provide powerful insight into cardiopulmonary physiology and guide diagnosis and management.